Performance Utilities
This project creates some useful performance monitoring and measurement utilities.
load-tool.sh
The Load tool is intended to do the following:
- Generate a load at a specific events per second into kafka
- The messages are taken from a template file, where there is a message template per line
- The load can be biased (e.g. 80% of the load can be comprised of 20% of the templates)
- Monitor the kafka offsets for a topic to determine the events per second written
- This could be the topic that you are generating load on
- This could be another topic that represents the output of some topology (e.g. generate load on enrichments and monitor indexing to determine the throughput of the enrichment topology).
usage: Generator
 -bs,--sample_bias <BIAS_FILE>         The discrete distribution to bias
                                       the sampling. This is a CSV of 2
                                       columns.  The first column is the %
                                       of the templates and the 2nd column
                                       is the probability (0-100) that
                                       it's chosen.  For instance:
                                       20,80
                                       80,20
                                       implies that 20% of the templates
                                       will comprise 80% of the output and
                                       the remaining 80% of the templates
                                       will comprise 20% of the output.
 -c,--csv <CSV_FILE>                   A CSV file to emit monitoring data
                                       to.  The format is a CSV with the
                                       following schema: timestamp, (name,
                                       eps, historical_mean,
                                       historical_stddev)+
 -cg,--consumer_group <GROUP_ID>       Consumer Group.  The default is
                                       load.group
 -e,--eps <EPS>                        The target events per second
 -h,--help                             Generate Help screen
 -k,--kafka_config <CONFIG_FILE>       The kafka config.  This is a file
                                       containing a JSON map with the
                                       kafka config.
 -l,--lookback <LOOKBACK>              When summarizing, how many
                                       monitoring periods should we
                                       summarize over?  If 0, then no
                                       summary.  Default: 5
 -md,--monitor_delta_ms <TIME_IN_MS>   The time (in ms) between monitoring
                                       output. Default is 10000
 -mt,--monitor_topic <TOPIC>           The kafka topic to monitor.
 -ot,--output_topic <TOPIC>            The kafka topic to write to
 -p,--threads <NUM_THREADS>            The number of threads to use when
                                       extracting data.  The default is
                                       the number of cores of your
                                       machine.
 -sd,--send_delta_ms <TIME_IN_MS>      The time (in ms) between sending a
                                       batch of messages. Default is 100
 -t,--template <TEMPLATE_FILE>         The template file to use for
                                       generation.  This should be a file
                                       with a template per line with
                                       $METRON_TS and $METRON_GUID in the
                                       spots for timestamp and guid, if
                                       you so desire them.
 -tl,--time_limit_ms <MS>              The total amount of time to run
                                       this in milliseconds.  By default,
                                       it never stops.
 -z,--zk_quorum <QUORUM>               zookeeper quorum
Templates
Messages are drawn from a template file. A template file has a message template per line.
For instance, let’s say we want to generate JSON maps with fields: source.type, ip_src_addr and ip_dst_addr. We can generate a template file with a template like the following per line:
{ "source.type" : "asa", "ip_src_addr" : "127.0.0.1", "ip_dst_addr" : "191.168.1.1" }
When messages are generated, there are some special replacements that can be used: $METRON_TS and $METRON_GUID. We can adjust our previous template to use these like so:
{ "source.type" : "asa", "ip_src_addr" : "127.0.0.1", "ip_dst_addr" : "191.168.1.1", "timestamp" : $METRON_TS, "guid" : "$METRON_GUID" }
One note about GUIDs generated. We do not generate global UUIDs, they are unique only within the context of a given generator run.
Biased Sampling
This load tool can be configured to use biased sampling. This is useful if, for instance, you are trying to model data which is not distributed uniformly, like many types of network data. Generating synthetic data with similar distribution to your regular data will enable the caches to be exercised in the same way, for instance, and yield a more realistic scenario.
You specify the biases in a csv file with 2 columns:
- The first column represents the % of the templates
- The second column represents the % of the generated output.
A simple example would be to generate samples based on Pareto’s principle:
20,80
80,20
This would yield biases that mean the first 20% of the templates in the template file would comprise 80% of the output.
A more complex example might be:
20,80
20,5
50,1
10,14
This would would imply:
- The first 20% of the templates would comprise 80% of the output
- The next 20% of the templates would comprise 5% of the output
- The next 50% of the templates would comprise 1% of the output
- The next 10% of the templates would comprise 14% of the output.
CSV Output
For those who would prefer a different visualization or wish to incorporate the output of this tool into an automated test, you can specify a file to emit data in CSV format to via the -c or --csv option.
The CSV columns are as follows:
- timestamp in epoch millis
If you are generating synthetic data, then:
- “generated”
- The events per second generated
- The mean of the events per second generated for the the last k runs, where k is the lookback (set via -l and defaulted to 5)
- The standard deviation of the events per second generated for the last k runs, where k is the lookback (set via -l and defaulted to 5)
If you are monitoring a topic, then:
- “throughput measured”
- The events per second measured
- The mean of the events per second measured for the the last k runs, where k is the lookback (set via -l and defaulted to 5)
- The standard deviation of the events per second measured for the last k runs, where k is the lookback (set via -l and defaulted to 5)
Obviously, if you are doing both generating and monitoring the throughput of a topic, then all of the columns are added.
An example of CSV output is:
1520506955047,generated,,,,throughput measured,,,
1520506964896,generated,1045,1045,0,throughput measured,,,
1520506974896,generated,1000,1022,31,throughput measured,1002,1002,0
1520506984904,generated,999,1014,26,throughput measured,999,1000,2
1520506994896,generated,1000,1011,22,throughput measured,1000,1000,1
1520507004896,generated,1000,1008,20,throughput measured,1000,1000,1
Use-cases for the Load Tool
Measure Throughput of a Topology
One can use the load tool to monitor performance of a kafka-to-kafka topology. For instance, we could monitor the throughput of the enrichment topology by monitoring the enrichments kafka topic:
$METRON_HOME/bin/load_tool.sh -mt enrichments -z $ZOOKEEPER
Generate Synthetic Load and Measure Performance
One can use the load tool to generate synthetic load and monitor performance of a kafka-to-kafka topology. For instance, we could monitor the performance of the enrichment topology. It is advised to start the enrichment topology against a new topic and write to a new topic so as to not pollute your downstream indices. So, for instance we could create a kafka topic called enrichments_load by generating load on it. We could also create a new kafka topic called indexing_load and configure the enrichment topology to output to it. We would then generate load on enrichments_load and monitor indexing_load.
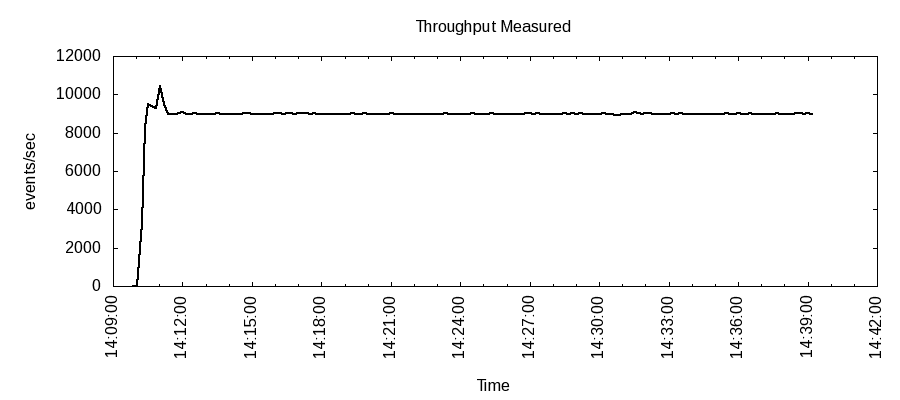
#Threadpool of size 5, you want somewhere between 5 and 10 depending on the throughput numbers you're trying to drive
#Messages drawn from ~/dummy.templates, which is a message template per line
#Generate at a rate of 9000 messages per second
#Emit the data to a CSV file ~/measurements.csv
$METRON_HOME/bin/load_tool.sh -p 5 -ot enrichments_load -mt indexing_load -t ~/dummy.templates -eps 9000 -z $ZOOKEEPER -c ~/measurements.csv
Now, with the help of a bash function and gnuplot we can generate a plot of the historical throughput measurements for indexing_load:
# Ensure that you have installed gnuplot and the liberation font package
# via yum install -y gnuplot liberation-sans-fonts
# We will define a plot function that will generate a png plot.  It takes
# one arg, the output file.  It expects to have a 2 column CSV streamed
#  with the first dimension being the timestamp and the second dimension
# being what you want plotted.
plot() {
  awk -F, '{printf "%d %d\n", $1/1000, $2} END { print "e" }' | gnuplot -e "reset;clear;set style fill solid 1.0 border -1; set nokey;set title 'Throughput Measured'; set xlabel 'Time'; set boxwidth 0.5; set xtics rotate; set ylabel 'events/sec';set xdata time; set timefmt '%s';set format x '%H:%M:%S';set term png enhanced font '/usr/share/fonts/liberation/LiberationSans-Regular.ttf' 12 size 900,400; set output '$1';plot '< cat -' using 1:2 with line lt -1 lw 2;"
}

# We want to transform the CSV file into a space separated file with the
# timestamp followed by the throughput measurements.
cat ~/measurements.csv | awk -F, '{printf "%d,%d\n", $1, $8 }' | plot performance_measurement.png
This generates a plot like so to performance_measurement.png: